What Do Home Owners Want from a Remodel?
More than two-thirds (69%) of home owners want to update their home's appearance, according to a new survey of 2,000 home owners done by One Poll in conjunction with Andersen Windows. But what exactly do they want? A few features topping their wish lists include more open space (31%), more natural light (30%), and improved function (34%).
A recent project by Ridgewood, N.J.-based MIF Design achieves all of this (and more). Let's explore how this full-service design-build company transformed a dated split-level into a transitional colonial.
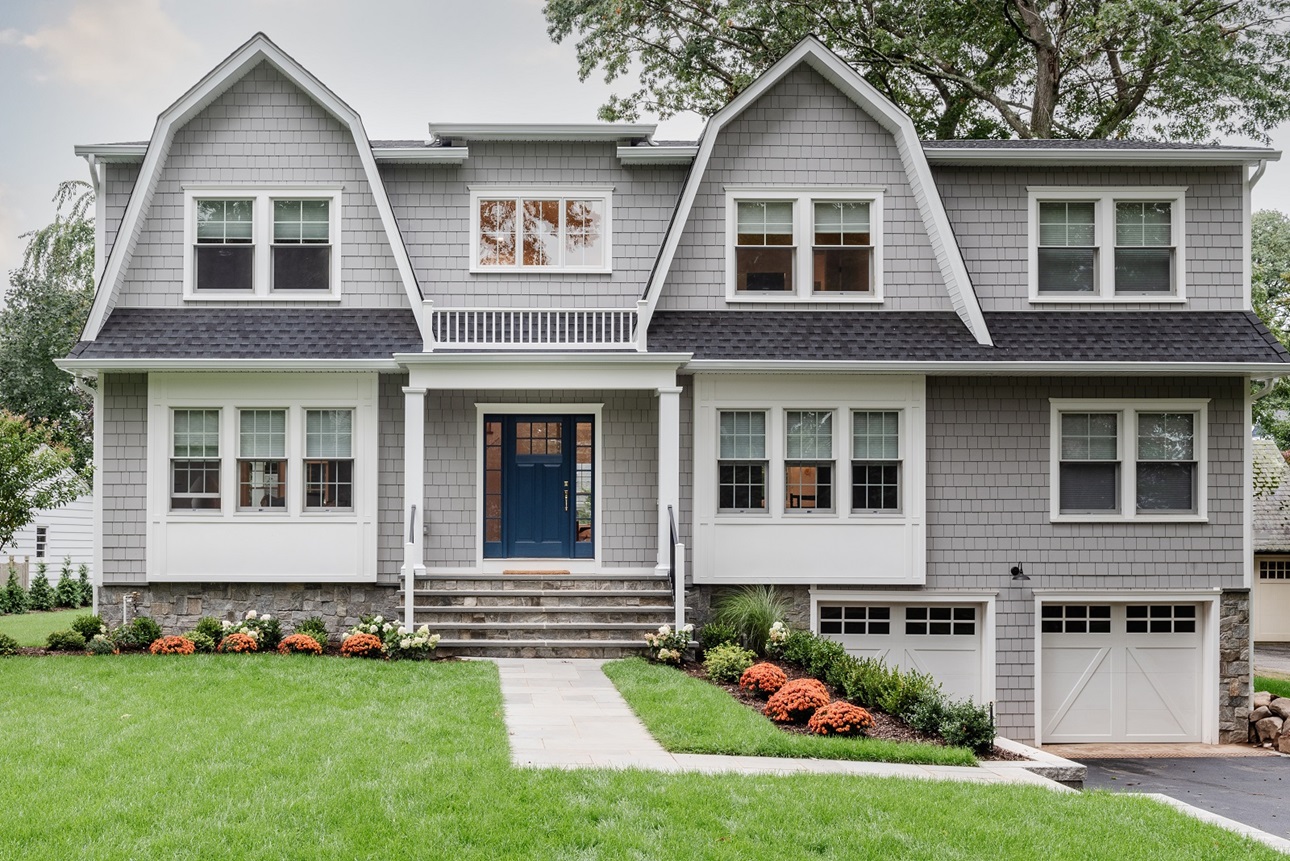 Photo by Linda Pordon
From split-level to transitional colonial
When the couple behind MIF Design — principal designer Yana Bouchkanets and builder Mike Flider — took on this remodel, they knew it had the potential to become the "beautiful, bright and airy home" their clients were seeking. Sure, it was dated, and its split-level layout added a layer of complication, but the home was in a great neighborhood and had a larger-than-average lot.
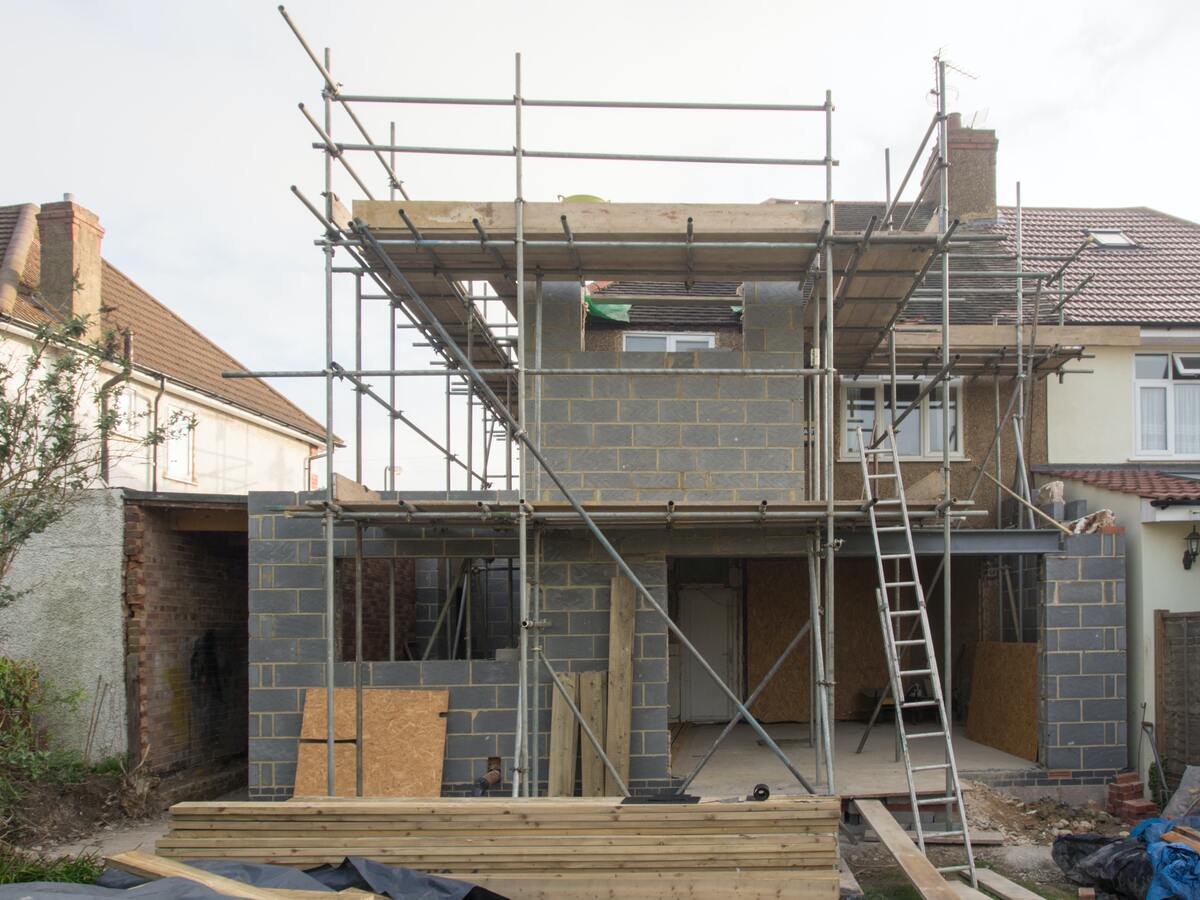
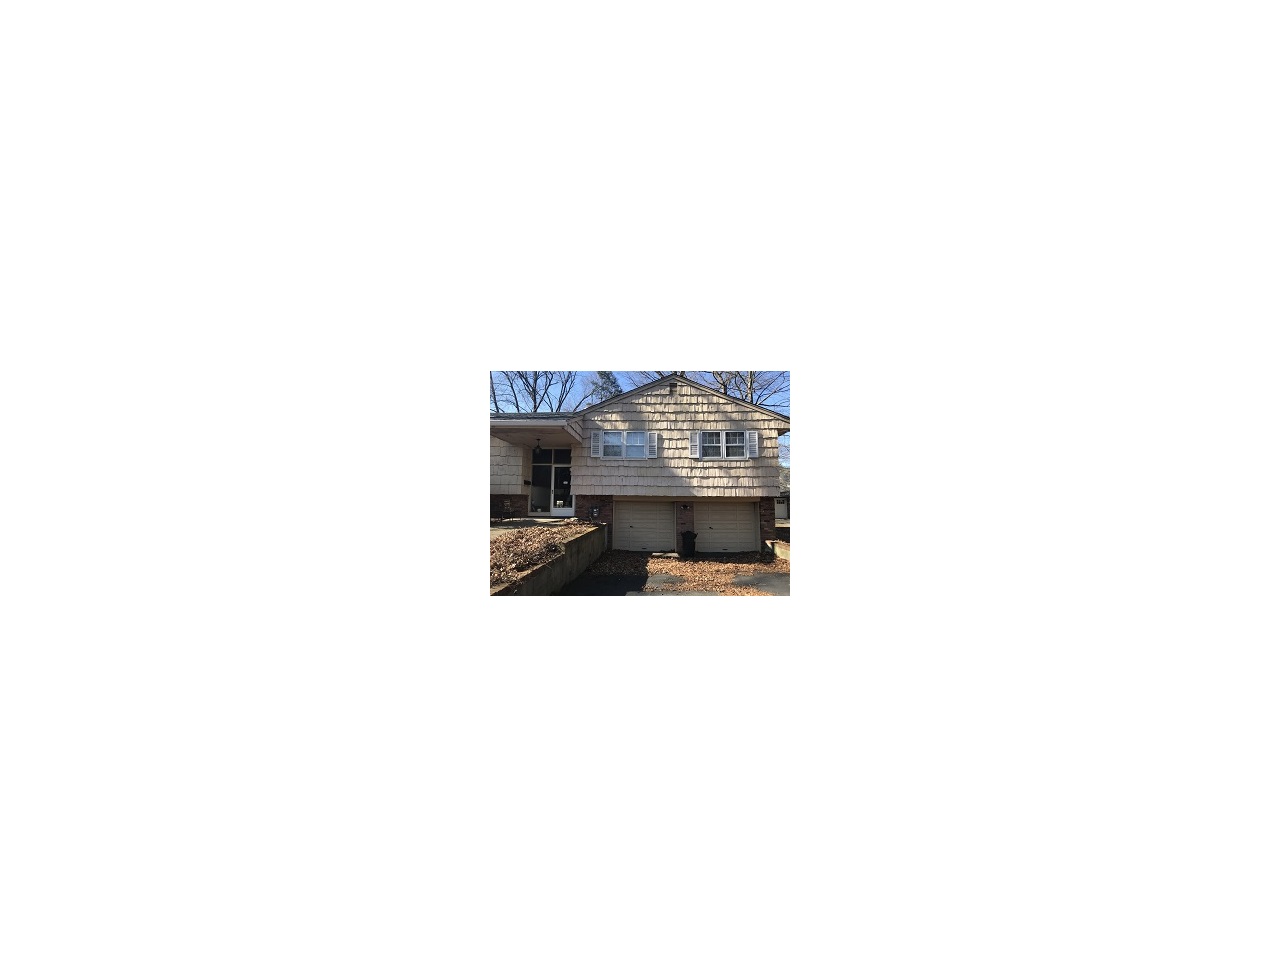 Before the remodel, the home was a dated split-level.
So, working together with their team of trusted craftspeople, they took the home down to the studs, keeping the original foundation and the tuck-under garage, while also managing to turn it into a two-story home that's certainly up to today's living standards.
Adding more open space
To add more open space, they united the kitchen, family room, and a breakfast nook into an open concept room that very much exemplifies what Bouchkanets said clients want.
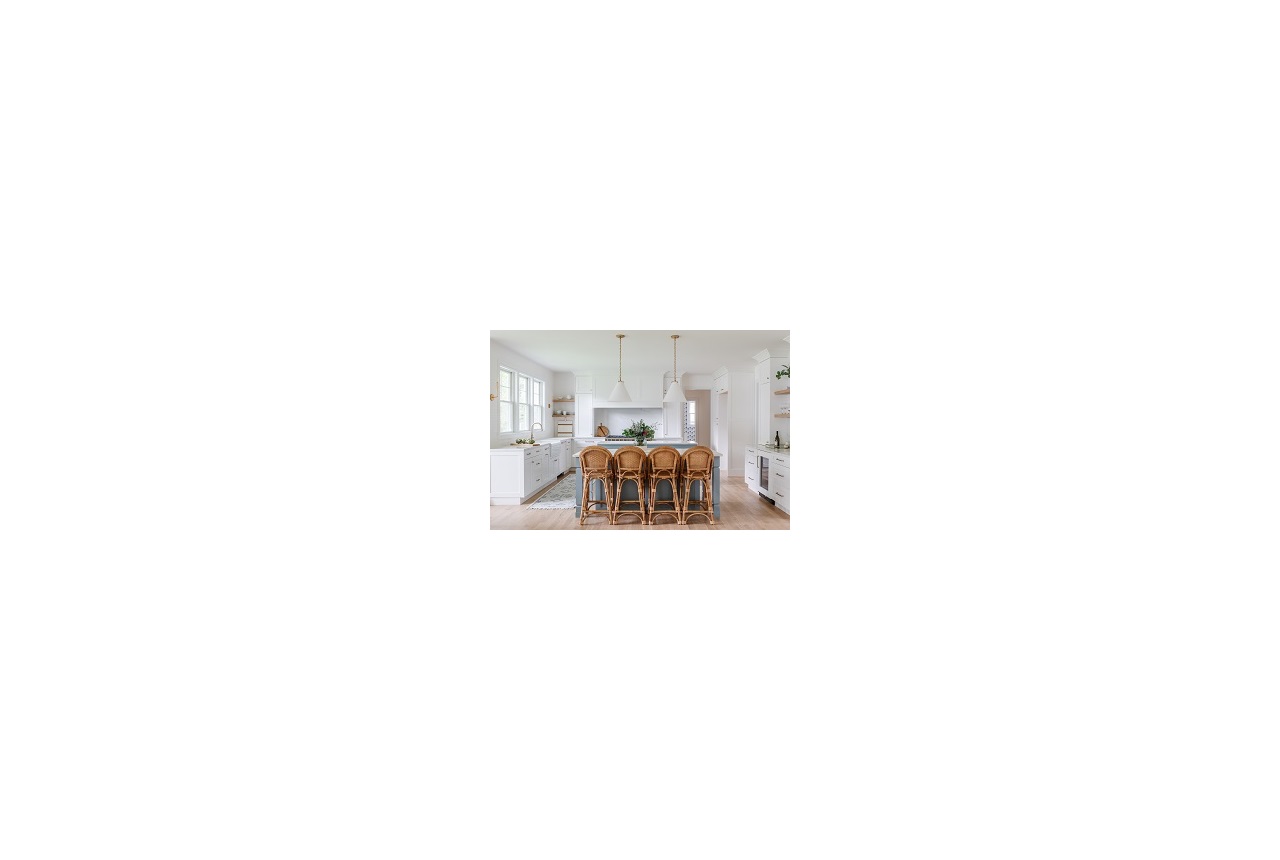 With double islands, a quartz backsplash and custom cabinetry, this beautiful kitchen is also high on functionality. Photo by Linda Pordon
"A really big trend is treating kitchens more like living rooms," she said. While clients want a space that's beautiful enough for entertaining, with features like the double islands, custom range hood and quartz backsplash featured in this "big impact kitchen," they also want comfort and functionality. This means durable materials that will stand up to everyday family use (quartz instead of marble) and comfortable features (like the fireplace and couch in this space).
In short, clients are looking for designs that turn the kitchen into a "more comfortable space where you want to spend time," Bouchkanets said.
Adding natural light
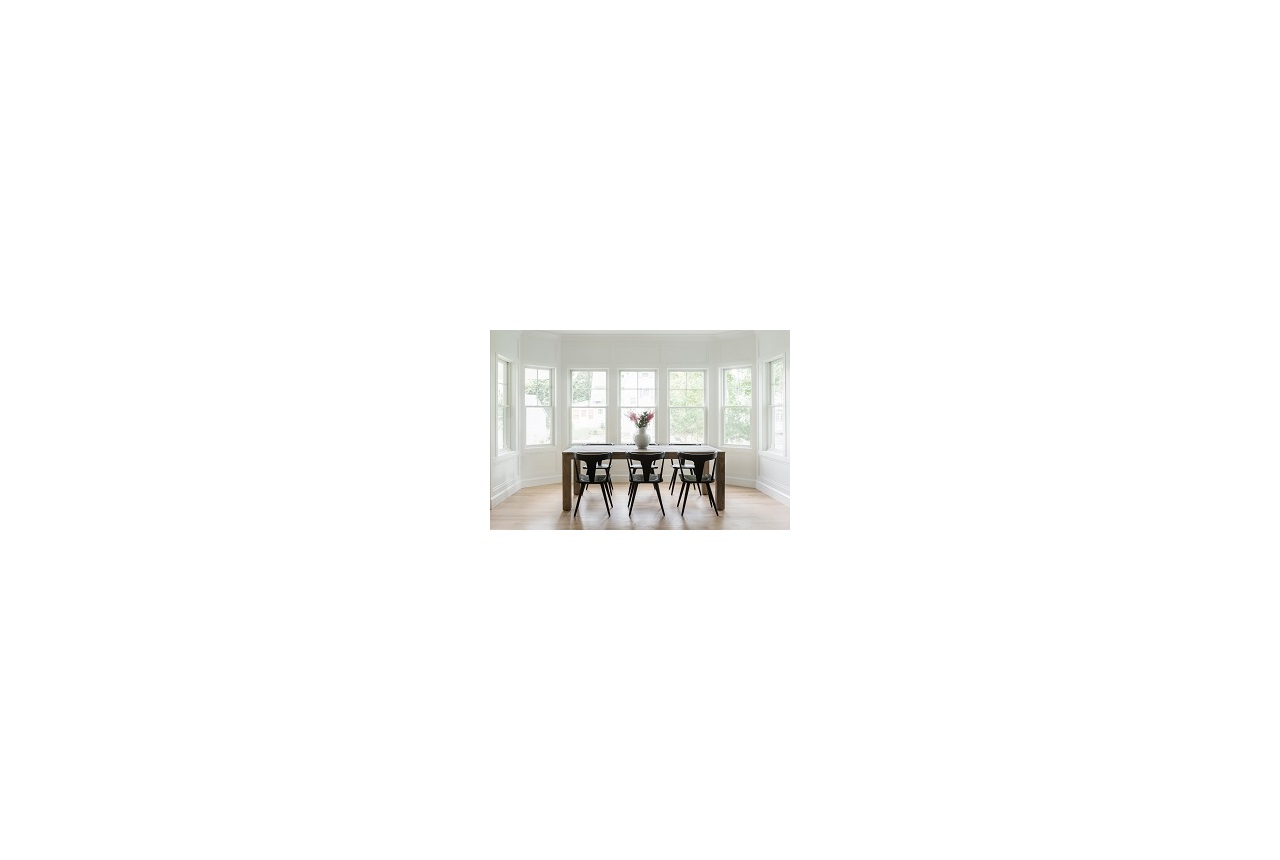 This sunny breakfast nook is part of the kitchen space and a perfect place for the kids to hang out while their parents cook. Photo by Linda Pordon
The combination of a more open layout and strategic window placement resulted in "endless natural light," as Bouchkanets describes it. The neighborhood is dense, so the design focused on adding windows to more public spaces at the front and back of the home and relying on the open concept to help light penetrate further.
Two impactful features include a wall of windows in the breakfast nook and the adjacent French doors. Together, they offer large expanses of backyard-facing glass letting in tons of unobstructed light and making this inviting space "everyone's favorite spot in the house," Bouchkanets said.
The purposeful selection of white frames and grilles not only suits the modern classic design, it also helps further the "bright and airy" look. Beyond the aesthetic benefits, these new windows and doors are also contributing to improved function and energy efficiency in the home.
Improving function
Other ways this home exemplifies the functional features today's home owners are asking for include:
- Easily accessible outdoor living space — The covered patio off the family room acts as an extension of the room and removes a barrier to going outside because "you're partially protected and you don't need shoes," Bouchkanets said.
- An office/flex space — Home offices have been on the rise since in recent years, and the first-floor office in this home not only functions as a work space, it also offers resale value in its versatility. It could be used as a playroom, a library, or serve myriad other functions under new ownership.
- Built-ins — All throughout the home, built-in cabinetry was added, including significant shelving, cabinet and drawer additions that perfectly suit a family home, while also adding a touch of traditional style.
All these features fall under a trend that Bouchkanets thinks is the most significant one coming out of COVID: A desire to make every inch count. After spending so much time at home, her clients are increasingly asking for help optimizing the entire home: "Let's talk about the basement, let's talk about the outdoor space, and how we can utilize it more," Bouchkanets said.
Wondering what else will be new in 2023? Explore more of the trends we think home owners will be asking for next year, or find stories from the field on our new Pro Views blog.
*Note: All articles have been redistributed from NAHBnow.com*